Per 100 g, Salmon has 206 calories and 22.1 g of protein, while Canned tuna has 116 calories and 25.5 g. Canned tuna is the lighter choice, 90 kcal fewer per 100 g. Canned tuna carries more protein, 3.4 g more per 100 g.
| Per 100 g | Salmon | Canned tuna |
|---|---|---|
| Calories | 206 kcal | 116 kcal |
| Protein | 22.1 g | 25.5 g |
| Carbs | 0 g | 0 g |
| Fat | 12.4 g | 0.8 g |
| Fiber | 0 g | 0 g |
Canned tuna wins on both: fewer calories and more protein per 100 g.
Both columns are USDA FoodData Central numbers — the same sourced data Joules logs from, rather than the crowd-sourced entries that make many trackers disagree with each other.
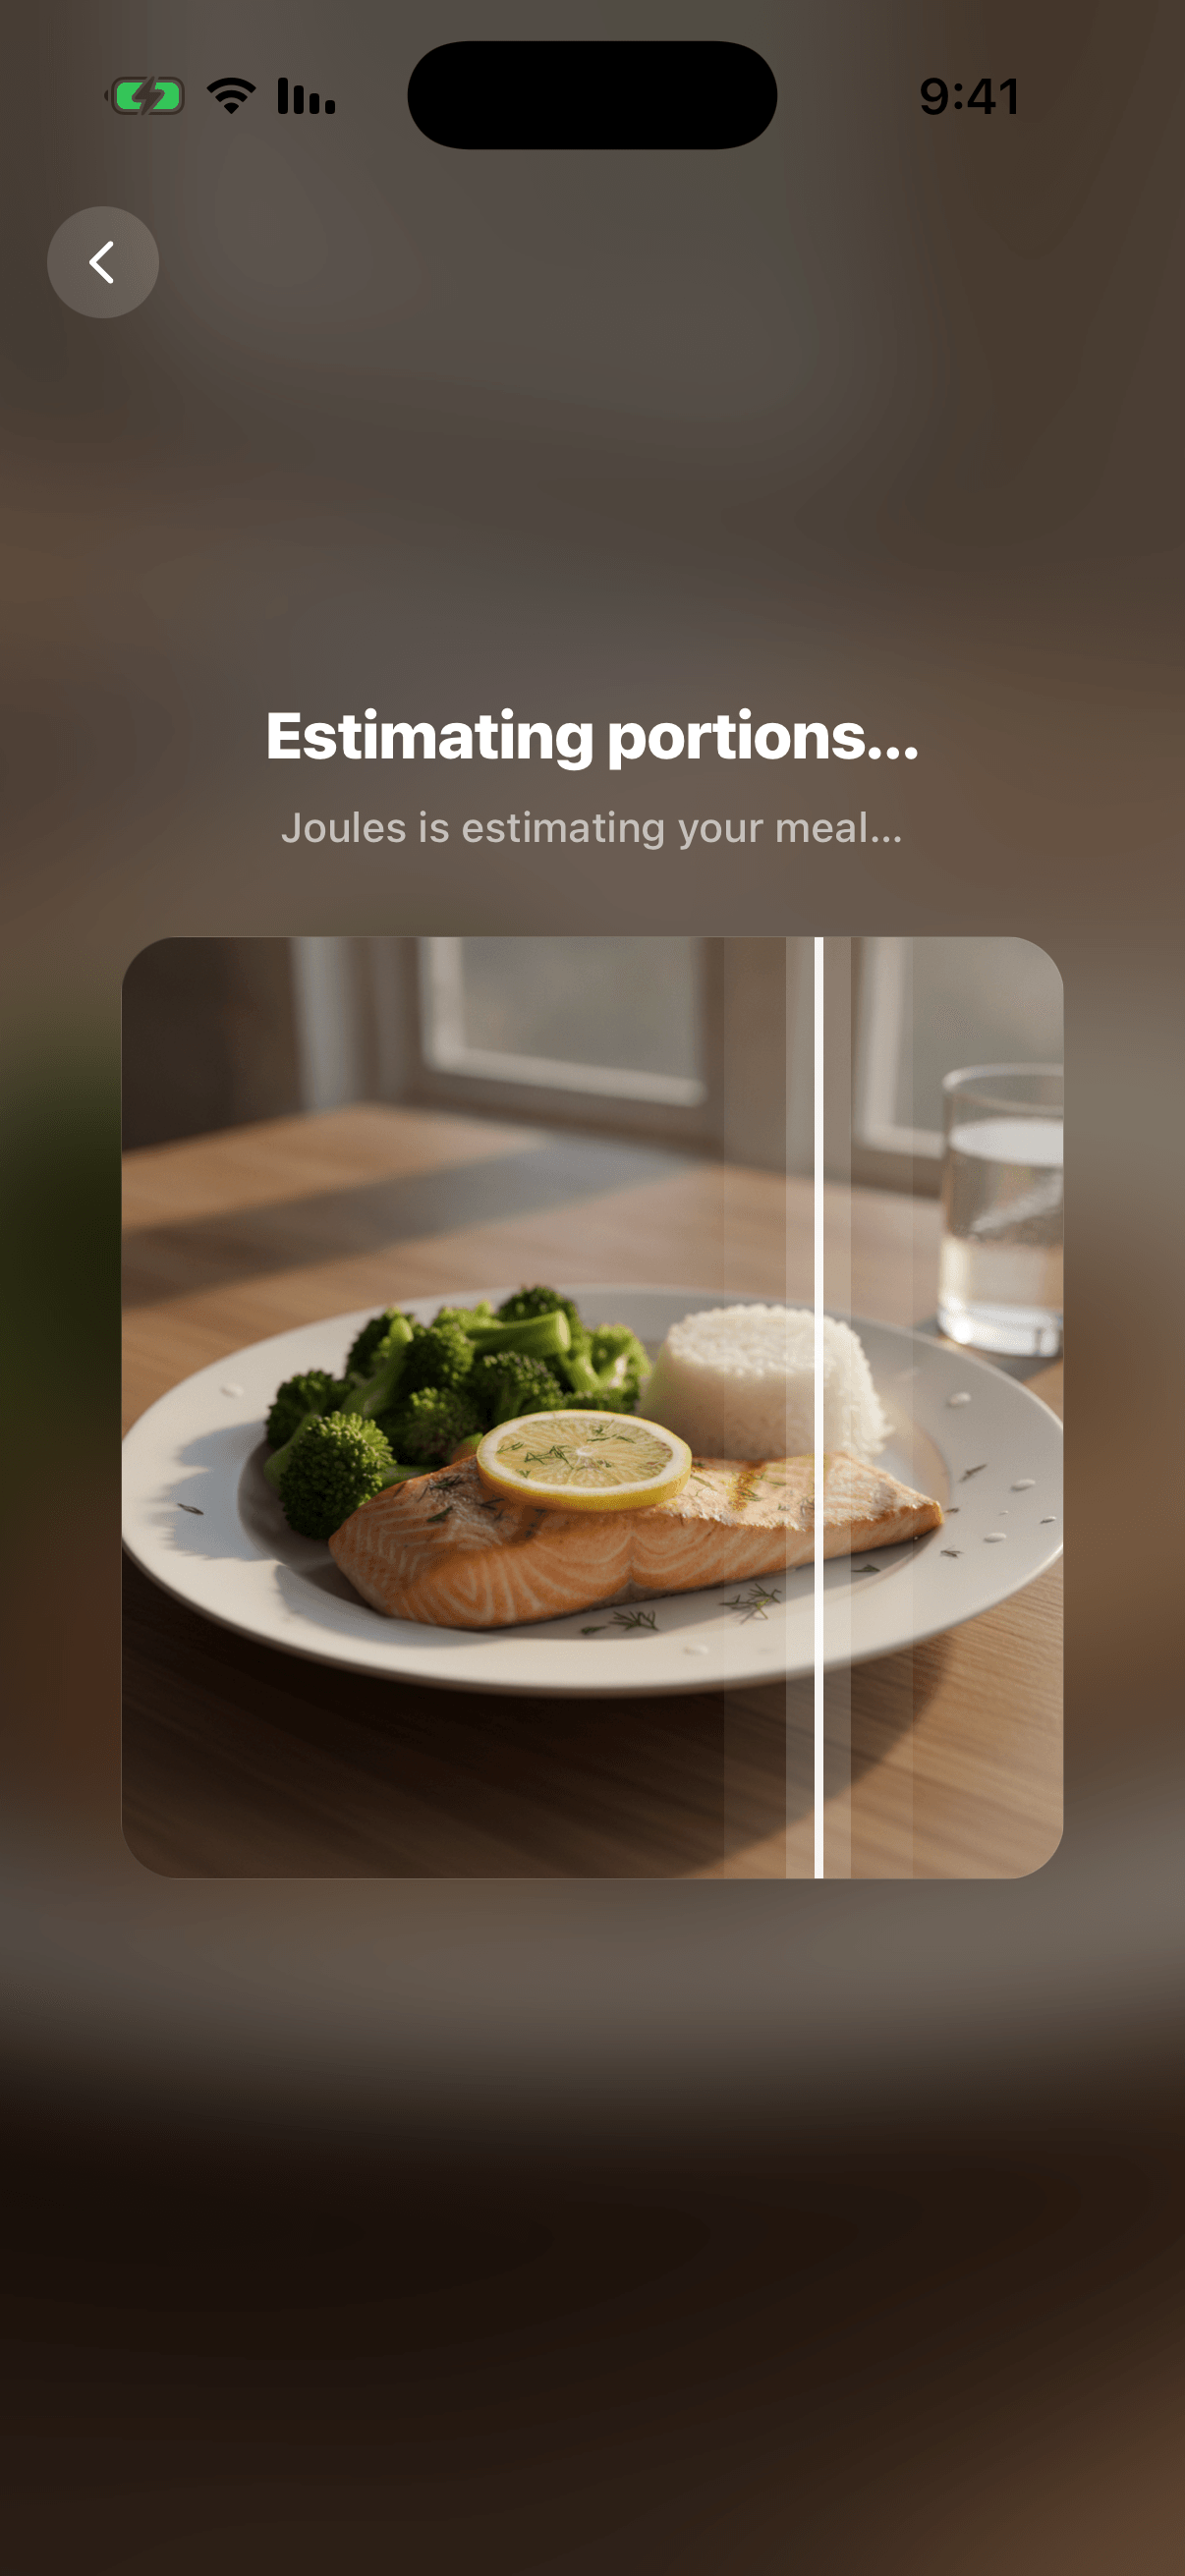
Per 100 g, Salmon has 206 calories and Canned tuna has 116. Canned tuna is lower by 90 kcal. Compare per 100 g first, then scale to your actual portion.
Per 100 g, Salmon has 22.1 g of protein and Canned tuna has 25.5 g. Canned tuna has 3.4 g more.
Neither is off-limits. Fewer calories per 100 g gives you more room in a deficit, but portion size and the rest of your day matter more than the swap itself. Log whichever you actually eat and watch your daily total.
Both foods come from USDA FoodData Central (SR Legacy): FDC ID 175168 for Salmon and 171986 for Canned tuna, taken per 100 g so the comparison is like-for-like.
Snap a photo of Salmon or Canned tuna in Joules and the calories and macros are logged for you — from the same USDA data.
Get JoulesA note on accuracy: calculators like this one provide estimates based on population-level formulas — your real needs vary with genetics, muscle mass, medical conditions, and more. Results are for information only and are not medical advice, a diagnosis, or a prescription. Talk to a doctor or registered dietitian before making significant changes to your diet or exercise, especially if you have a health condition, are pregnant, or are under 18.
Nutrition data: USDA FoodData Central, FDC ID 175168 · FDC ID 171986 (SR Legacy), per 100 g. Both entries are compared on the same basis.
